Arc flash is a sudden, explosive release of energy from an...
ReadIs 5 to 15 times the nominal current the first thing that comes to your mind when you hear the word “inrush”? Most likely the second would be the unpleasant feeling that saturations and non-linearities cause in most engineers, but that’s beyond the scope of this article.
Do you typically proceed based on the worst-case scenario?
You may want to reconsider the “X times the nominal current” approach because in reality, and regardless of this being about a new facility or an existing one, inrush is one of those phenomena for which the “it depends” approach is better in majority of cases, and for which hardly ever dogmatic, worst-case predictions are true.
This article explores what’s behind the “it depends” but first, let’s review certain terms and concepts around transformer magnetization and inrush. It is assumed that the reader has some basic understanding of transformers and magnetism.
Anatomy of the magnetizing current
So, what is transformer inrush? In simple terms, it is a phenomenon in which a transformer draws more current than it nominally would, during the first few cycles after it gets energized, in a way that deviates substantially from any steady state characteristic of the power system or the transformer itself, consequence of magnetic saturation in the core. Aspects like duration, severity, waveshape and dampening depend, as we will see in this article, on a plethora of factors.
At the forefront of the inrush phenomenon is the magnetization and hysteresis characteristics of the core of the transformer which, in cases of average quality, is typically built with cold-rolled, grain-oriented silicon steel. Figure 1 shows the shape of these magnetic characteristics, and their place in the equivalent circuit of a transformer. In the vertical axis of the hysteresis curve there is the magnetic flux density (B), and in the horizontal one, the magnetic field strength (H).
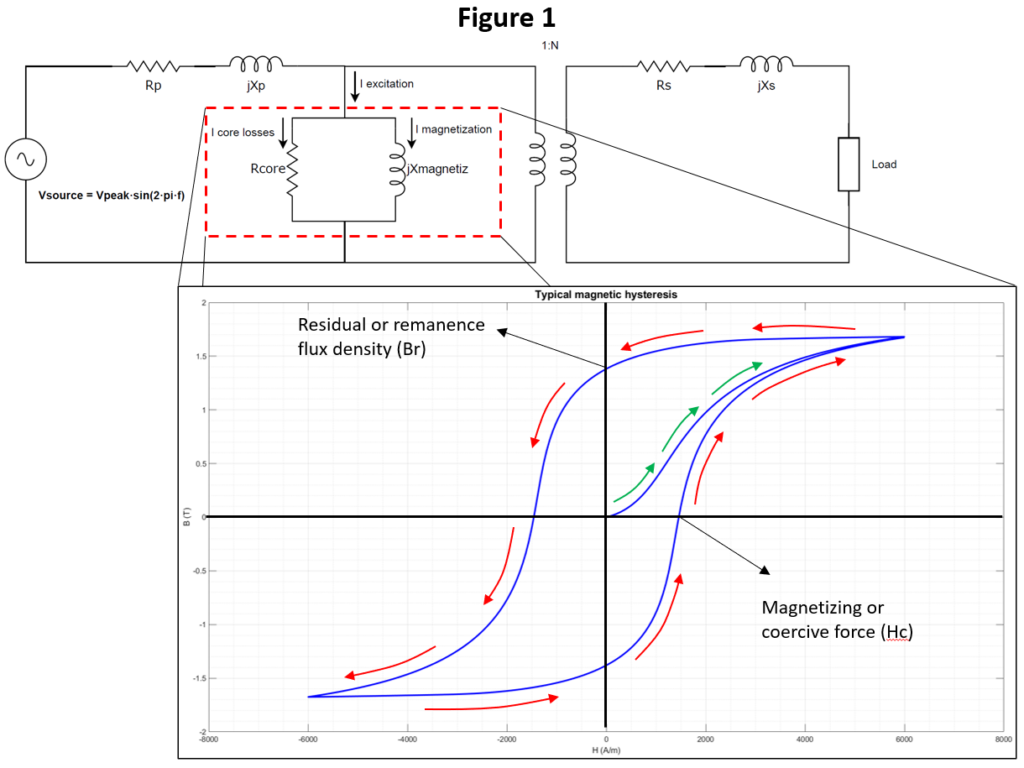
Figure 1 shows that, on the first energization of the transformer, the magnetization follows the green arrows from the origin, in a path known as the “initial magnetization curve”. If the transformer is connected to an AC voltage source, things will follow the red arrows once the initial magnetization curve reaches its maximum value, cyclically at the same frequency of the voltage applied.
Interestingly, 50% to 80% of the power losses represented by Rcore are in direct proportion to the area enclosed by the hysteresis loop, and the rest are attributed to eddy currents in the transformer core. Also, the residual flux density (Br) could be in the vicinity of 60% of the maximum flux density for silicon steels. The shape of the hysteresis curve is a function of the magnetic properties of the core material, its construction, lamination, the applied voltage magnitude and frequency and, up to a limited extent, the temperature.
When dealing with matters of magnetic hysteresis, it is the voltage applied to the transformer the one driving the magnetic flux. Furthermore, the waveshape of the flux is proportional to the voltage one, but delayed 90 electrical degrees. Hence, the hysteresis curve is not relevant for determining the magnetic flux, but for determining the current necessary to produce such flux, which circulates through the magnetizing inductance (Xmagnetiz) of Figure 1.
Therefore, the analysis of magnetizing currents and inrush must follow the “voltage drives flux, and flux drives current” approach. Figure 2 represents this sequence, so the voltage waveshape identified with the number 1 determines at which height in the vertical axis of the hysteresis loop the magnetic flux density (B) is, with a ¼ cycle delay. Then, the corresponding magnetic field strength (H) in the horizontal axis determines the magnetizing current, identified with the number 3.
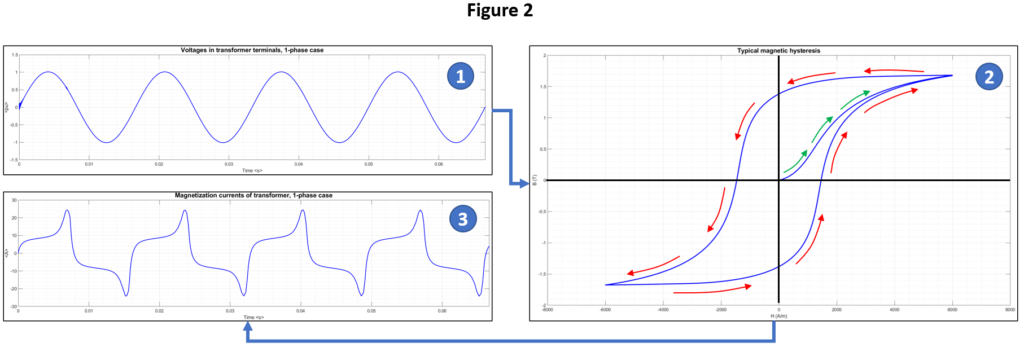
Figure 2, which corresponds to normal steady state operation of a single-phase transformer, clearly shows the extent of non-linearity of the magnetizing current, having a significant amount of 3rd, 7th and even 9th harmonics. An inductive phase shift with respect to the applied voltage can also be appreciated. The technical literature on all these topics is very mature, and in-deep mathematical elaborations and explanations can be found in the references included at the end of this article.
Anatomy of the inrush
In most cases, transformer inrush implies disconnecting the transformer after a period in which there was voltage applied and the magnetization currents had reached steady state (as shown in Figure 1), followed by a subsequent reconnection. Figure 3 provides a graphical representation in a sequential manner, from steady state, to disconnection, to reconnection, when the inrush occurs.
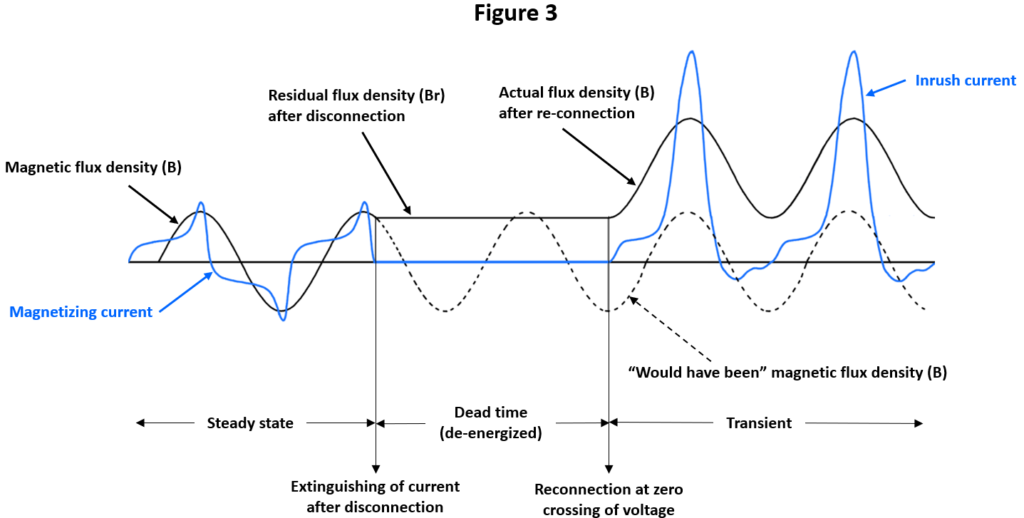
Starting from the steady state period, the disconnection of the transformer from its voltage source materializes when the magnetizing current crosses zero, irrespective of the value of voltage, flux, and even if the disconnecting means (most likely the poles a circuit breaker) opened at a moment other than such zero crossing. This is because the magnetizing current is highly inductive, and current interruption can only happen during zero crossings. In that exact moment the flux density in the core will get “frozen” in its residual value (Br), until the transformer is exposed again to voltage. Figure 3 shows what the magnetic flux density “would have been”, should a disconnection had never happened.
Let’s assume for the sake of academically seeing the worst-case, that the transformer is again reconnected to the same source, at the exact moment the voltage is crossing though zero in the ascending part of the wave which, for the “would have been” flux, means a negative peak. As the magnetic flux cannot change instantaneously, but rather behaves cumulatively, the residual flux density will add to what otherwise would have been the magnetic flux reaction to the application of voltage without such residual flux, elevating the waveshape of the magnetic flux density way above its steady state levels.
This, combined with the magnetic hysteresis concepts of Figure 1, results in the saturation of the magnetic flux density, i.e.: small increases in B, require enormous increases in H, which then drives the magnetization current to reach exceptionally high values in such saturation mode. After a few cycles, and due to a variety of dampening effects which include losses, the current peaks will decrease until reaching normal steady state again.
The example presented in Figure 3 corresponds to the very worst case of reconnection during zero voltage crossing, in a single-phase transformer. However, there is a wide range of possible outcomes when it comes to inrush, as the reconnection most likely would happen in a less unfavorable time, the residual flux density could be locked in its negative value, the source impedance could limit the current, and the transformer could be three phase, or three phase bank, instead of single. We will explore all those factors detrimental to inrush.
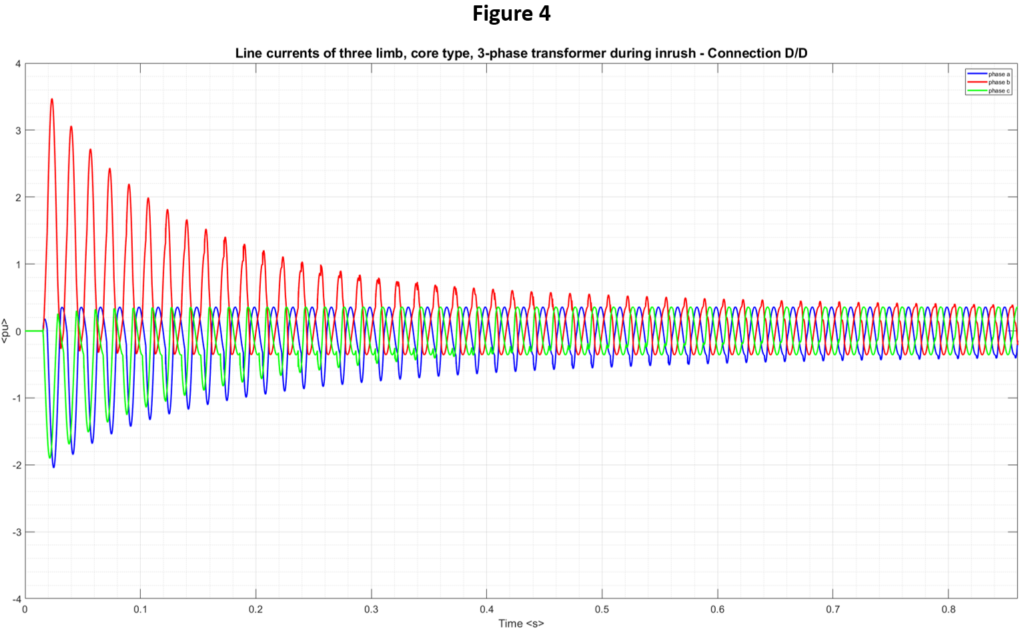
Figure 4 presents an example of line currents in a three phase, core type transformer during inrush. The figure, which corresponds to a 600V/480V, three phase core type transformer of 1500 kVA in Delta-Delta connection, exposed to a large power source, clearly shows the complexity of a three-phase inrush. Different types of three phase connections have different effects on inrush currents, and those will be addressed later in this article.
Factors affecting transformer inrush.
There are a considerable number of aspects affecting transformer inrush currents, and there is no “one size fits all” criteria that allow predicting the phenomenon in a given facility without customized, case-by-case analysis. In some instances, different aspects affect each other, or one aspect affects itself, compounding things in the beneficial or detrimental direction.
- The impedance of the source that energizes the transformer: the weaker the source, the higher its impedance, and the more limited the inrush current is, but also the more dramatic voltage sags are. Curiously, voltage sags diminish the saturation of the core, which effectively decreases inrush currents.
- The material of the transformer core, and its construction: not only affect the saturation of the core on both ends of the hysteresis loop, but the remanence flux density, which is a significant factor as explained in Figure 3. The quality of steel and core construction may intuitively be associated with better inrush performance, but such characteristics are mostly driven by motivations of efficiency, for which reducing losses (eddy currents and hysteresis loop size) is necessary. Two transformers with distinctively different quality materials and/or construction may not imply significantly different inrush performance.
- The maximum flux density in the hysteresis loop: it has been shown in the specialized literature that, the higher the maximum operational flux density (vertical axis in the hysteresis loop), the lower is the magnification of inrush current due to residual flux density.
- The magnitude and frequency of the voltage applied on the transformer: the higher the voltage, the closer the hysteresis cycle approaches saturation. An increase in frequency will elongate the hysteresis loop in the horizontal direction, therefore decreasing the value of the residual flux density. This, however, is not a common occurrence in power transformers.
- Whether the transformer is single phase, three-phase, and the type of connection (delta, wye): contrary to a single-phase transformer, in which the connection of the voltage source could theoretically be synchronized to fully eliminate inrush currents, three phase transformers are impossible to be connected without producing some inrush, as the right connection time in one phase is detrimental to the other two. The fact that the currents in a three-phase transformer must add up to zero complicates the inrush phenomena, but literature reports the intensity of inrush is less in transformers connected in three-phase as compared to the same transformers when considered single.
On the matter of connection types, it can be highlighted that:- Single phase units connected in isolated Y-Delta bank, and three-legged core three phase transformers, would generally show 2/3 of the maximum inrush currents they would if they were used as single-phase units.
- Transformers connected in delta in their primaries would see, on a winding-by-winding basis, the same inrush behavior as they would if they were single-phase. However, from the perspective of line currents, they would see inrush currents which are ~58% as severe as they would in equivalent single-phase units.
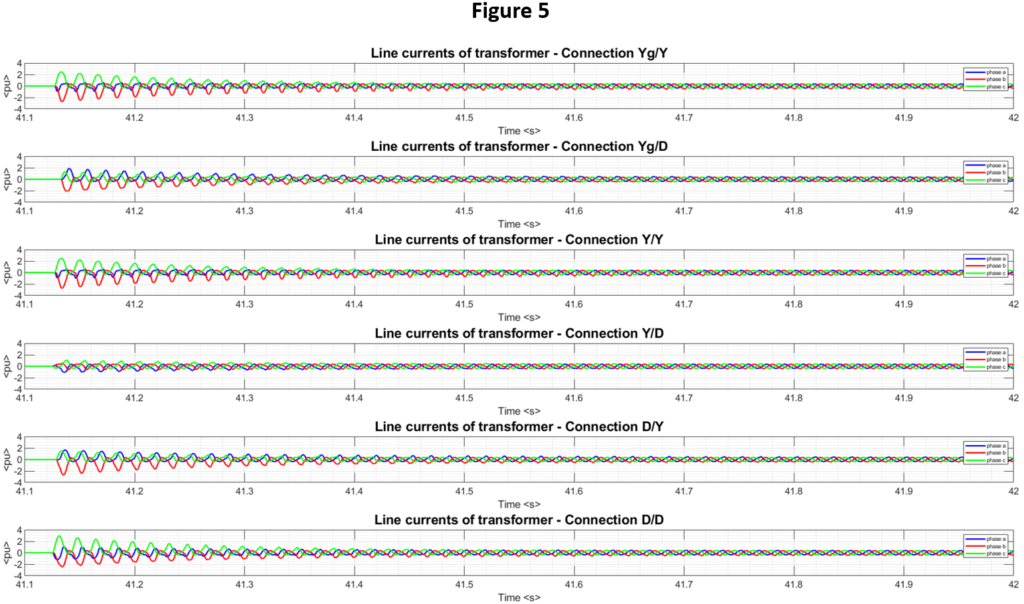
To illustrate how the connection of three phase transformers can alter the inrush current performance, a series of inrush simulations were performed in a 600V/480V, three-phase transformer bank of 1500 kVA, exposed to a large power source. For all simulations, all variables were fixed (including voltage angles to de-energize and energize), except the connection of the transformers themselves. There is distinctive differences in line currents between all six connections tested, in both magnitude and the predominant inrush phase.
- Reconnection angle in the voltage wave shape: as explained in Figure 3, the moment the energization occurs (voltage angle), which in most cases is a probabilistic event, combined with the remanent flux density, has a tremendous effect in the amount of inrush current.
Figure 6 corresponds to a 600V/480V, three phase core type transformer of 1500 kVA in Delta-Delta connection, exposed to 20 different inrush events, in which the only variation was the angle at which the source was connected to the transformer, probabilistically established between 0 and 360 electrical degrees. A vast range of inrush outcomes can be observed.
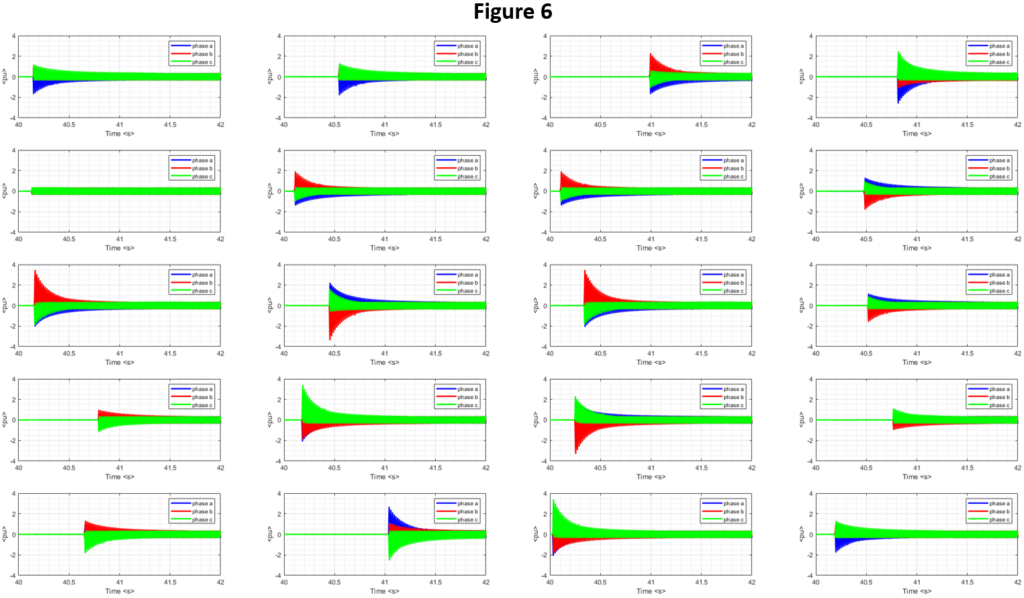
It is important to highlight, however, that the voltage connection is more likely to materialize in a voltage maximum (or minimum) than in a zero crossing (theoretical worst case of inrush), by the arc that most likely would appear between the contacts of the circuit breaker or contactor during a voltage peak, as the contacts approach each other. This, indeed, increases the probability of a low inrush event, and diminishes the probability of a high one. A closing near a zero voltage crossing is also probabilistically unlikely, as zero crossings are a small fraction of the whole power cycle. Finally, experience indicates dramatic inrush events are rare.
The true risk, and key takeaways
As it has been explained, as reported by specialized literature, and as several analyses we have performed in different types of power systems suggest, the true risk of inrush currents depends enormously on the application and context in which the phenomenon is expected, and in any case is not at all about a one-size-fits-all, worst case theoretical approach.
Instead, it is more likely than not that inrush currents may not be as severe as the worst-case theoretical scenarios would predict, as such worst-case scenarios generally require a stacking of pessimistic factors. On the other hand, the analysis of inrush requires a strong command of technical intricacies, as the problem is of above average complexity.
At Altus Dexter we pride ourselves on our ability to dominate challenging power system problems, like the analysis of transformer inrush, in both common and unique contexts. We rely on the latest simulation tools, computing capabilities, and technical competency to materialize clarity and solutions around complex technical problems. Reach out to discuss how we can help you tackle challenging power systems studies.
Recommended citation.
Pineda, F., “The true risk of transformer inrush currents”. Website article (2023). Altus Dexter. www.altusdexter.com
References
[1] Blume, Boyajian, Camilli, Lennox, Minneci, Montsinger, “Transformer Engineering, A Treatise on the Theory, Operation, and Application of Transformers”, John Wiley & Sons; 2nd edition, 1951.
[2] Central Station Engineers of the Westinghouse Electric Corporation, “Electrical Transmission and Distribution Reference Book”, The Westinghouse Electric Corporation, 1950.
[3] National Energy Technology Laboratory, “3% Silicon Steel Core Material (Grain-Oriented Electrical Steel)”
[4] McLyman, “Transformer and Inductor Design Handbook”, Marcel Decker, 2004.
[5] M. Bolhasani, S. S. H. Kamangar and S. Tavakoli, “Determination of distribution function of inrush current in three phase transformer using Monte Carlo method,” 2012 47th International Universities Power Engineering Conference (UPEC), Uxbridge, UK, 2012, pp. 1-7.
[6] Blume, Camilli, Farnham, Peterson, “Transformer Magnetizing Inrush Currents and Influence on System Operation”, AIEE Transactions, Vol. 63, 1944.
[7] McLyman, “Transformer and Inductor Design Handbook”, Marcel Dekker, 2004.

About the author
Fabian Pineda, P.E., is the Founder and Managing Director of Altus Dexter. He has extensive experience in project management, design, operation, reliability, and maintenance of electrical systems for industrial, oil, gas and offshore applications.
We also recommend
Electrical Reliability in Oil and Gas: A Study Case
In the high-stakes environment of oil and gas, electrical system reliability...
ReadCONTACT US
- (832) 773-1194
- info@altusdexter.com

